OncoThreads: Visualization of Large Scale Longitudinal Cancer Molecular Data
Abstract
Molecular profiling of patient tumors and liquid biopsies over time with next-generation sequencing technologies and new immuno-profile assays are becoming part of standard research and clinical practice. With the wealth of new longitudinal data, there is a critical need for visualizations for cancer researchers to explore and interpret temporal patterns not just in a single patient but across cohorts.
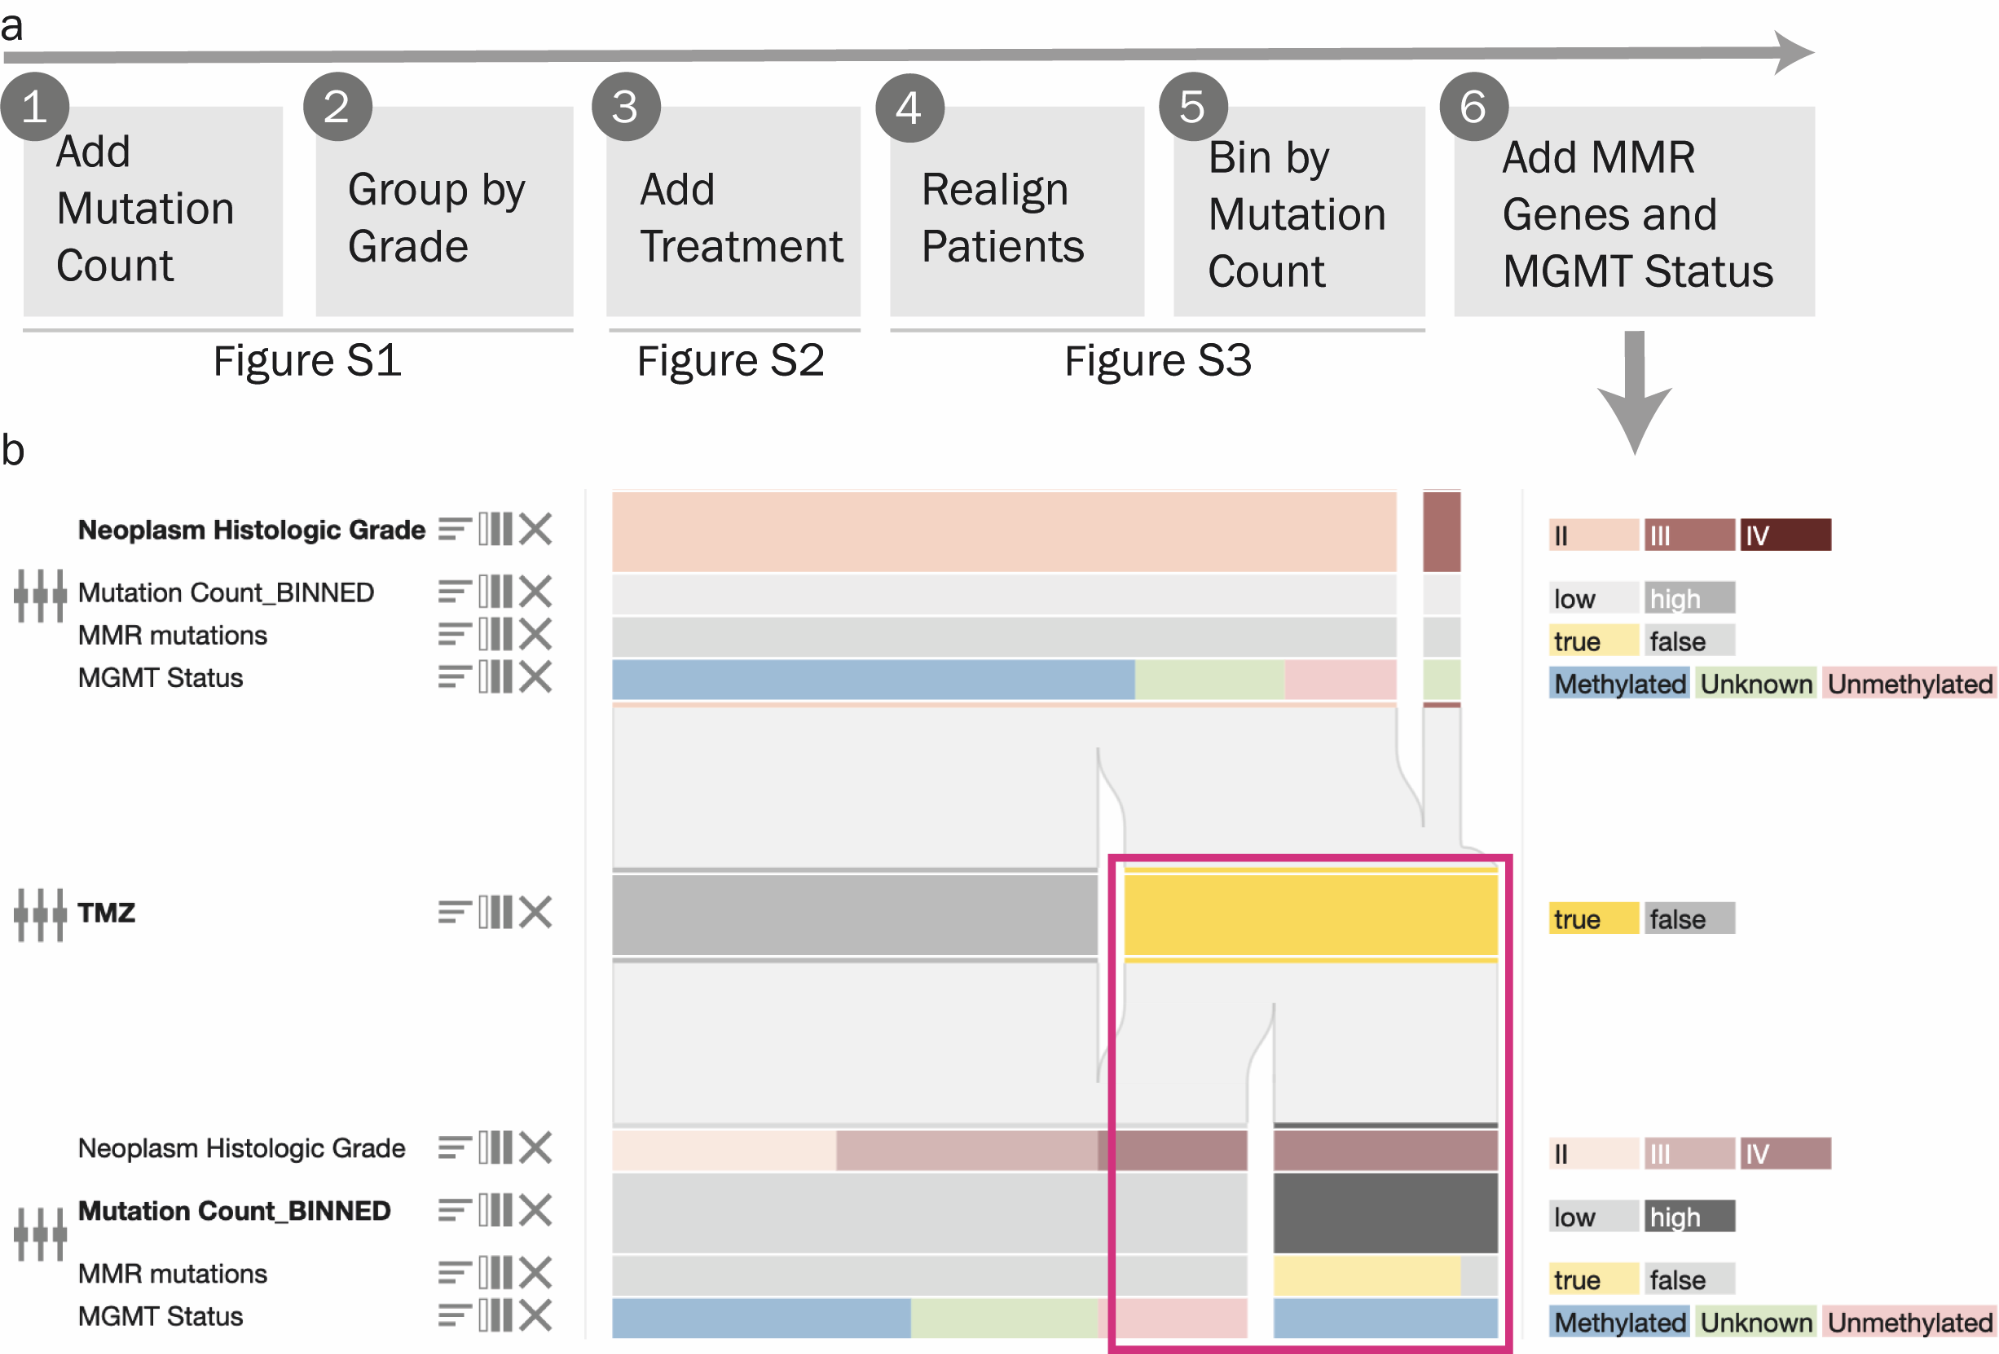
To address this need we developed OncoThreads, a tool for the visualization of longitudinal clinical and cancer genomics and other molecular data in patient cohorts. The tool visualizes patient cohorts as temporal heatmaps and Sankey diagrams that support the interactive exploration and ranking of a wide range of clinical and molecular features. This allows analysts to discover temporal patterns in longitudinal data, such as the impact of mutations on response to a treatment, e.g. emergence of resistant clones. We demonstrate the functionality of OncoThreads using a cohort of 23 glioma patients sampled at 2-4 timepoints.
Citation
TA Harbig, S Nusrat, T Mazor, Q Wang, A Thomson, H Bitter, E Cerami, N Gehlenborg. “OncoThreads: Visualization of Large Scale Longitudinal Cancer Molecular Data”, Bioinformatics (Oxford, England) 37(Suppl_1):i59-i66 (2021). doi:10.1093/bioinformatics/btab289