Periphery Plots for Contextualizing Heterogeneous Time-Based Charts
Abstract
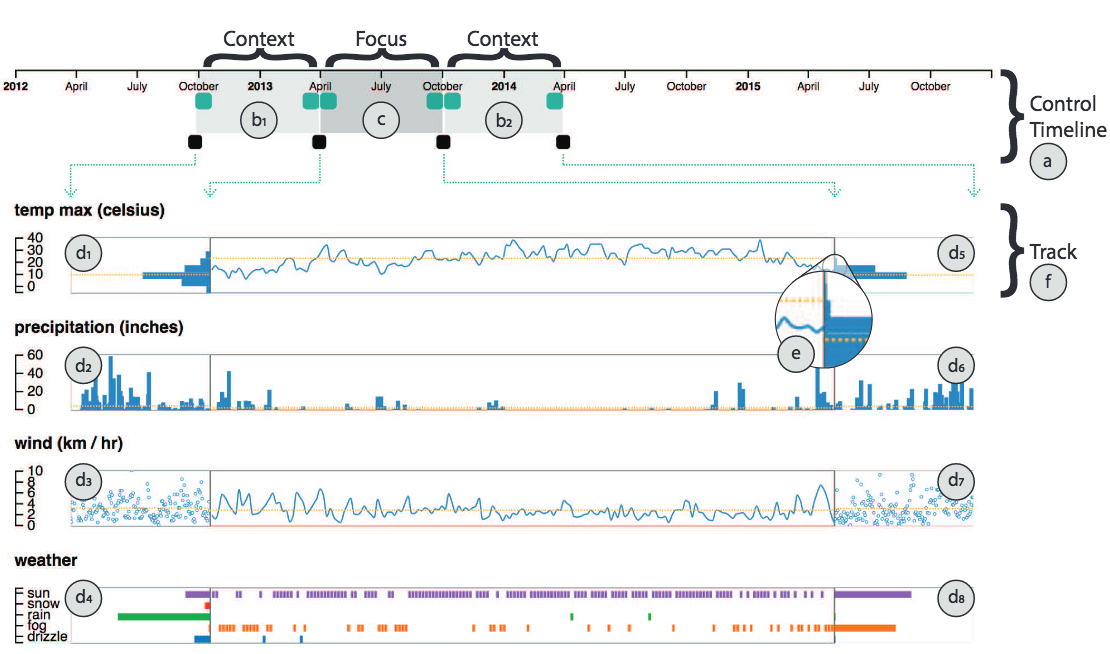
Patterns in temporal data can often be found across different scales, such as days, weeks, and months, making effective visualization of time-based data challenging. Here we propose a new approach for providing focus and context in time-based charts to enable interpretation of patterns across time scales. Our approach employs a focus zone with a time and a second axis, that can either represent quantities or categories, as well as a set of adjacent periphery plots that can aggregate data along the time, value, or both dimensions. We present a framework for periphery plots and describe two use cases that demonstrate the utility of our approach.
Citation
B Morrow, T Manz, AE Chung, N Gehlenborg, D Gotz. “Periphery Plots for Contextualizing Heterogeneous Time-Based Charts”, 2019 IEEE Visualization Conference (VIS) (2019). doi:10.1109/VISUAL.2019.8933582