GenoREC: A Recommendation System for Interactive Genomics Data Visualization
Abstract
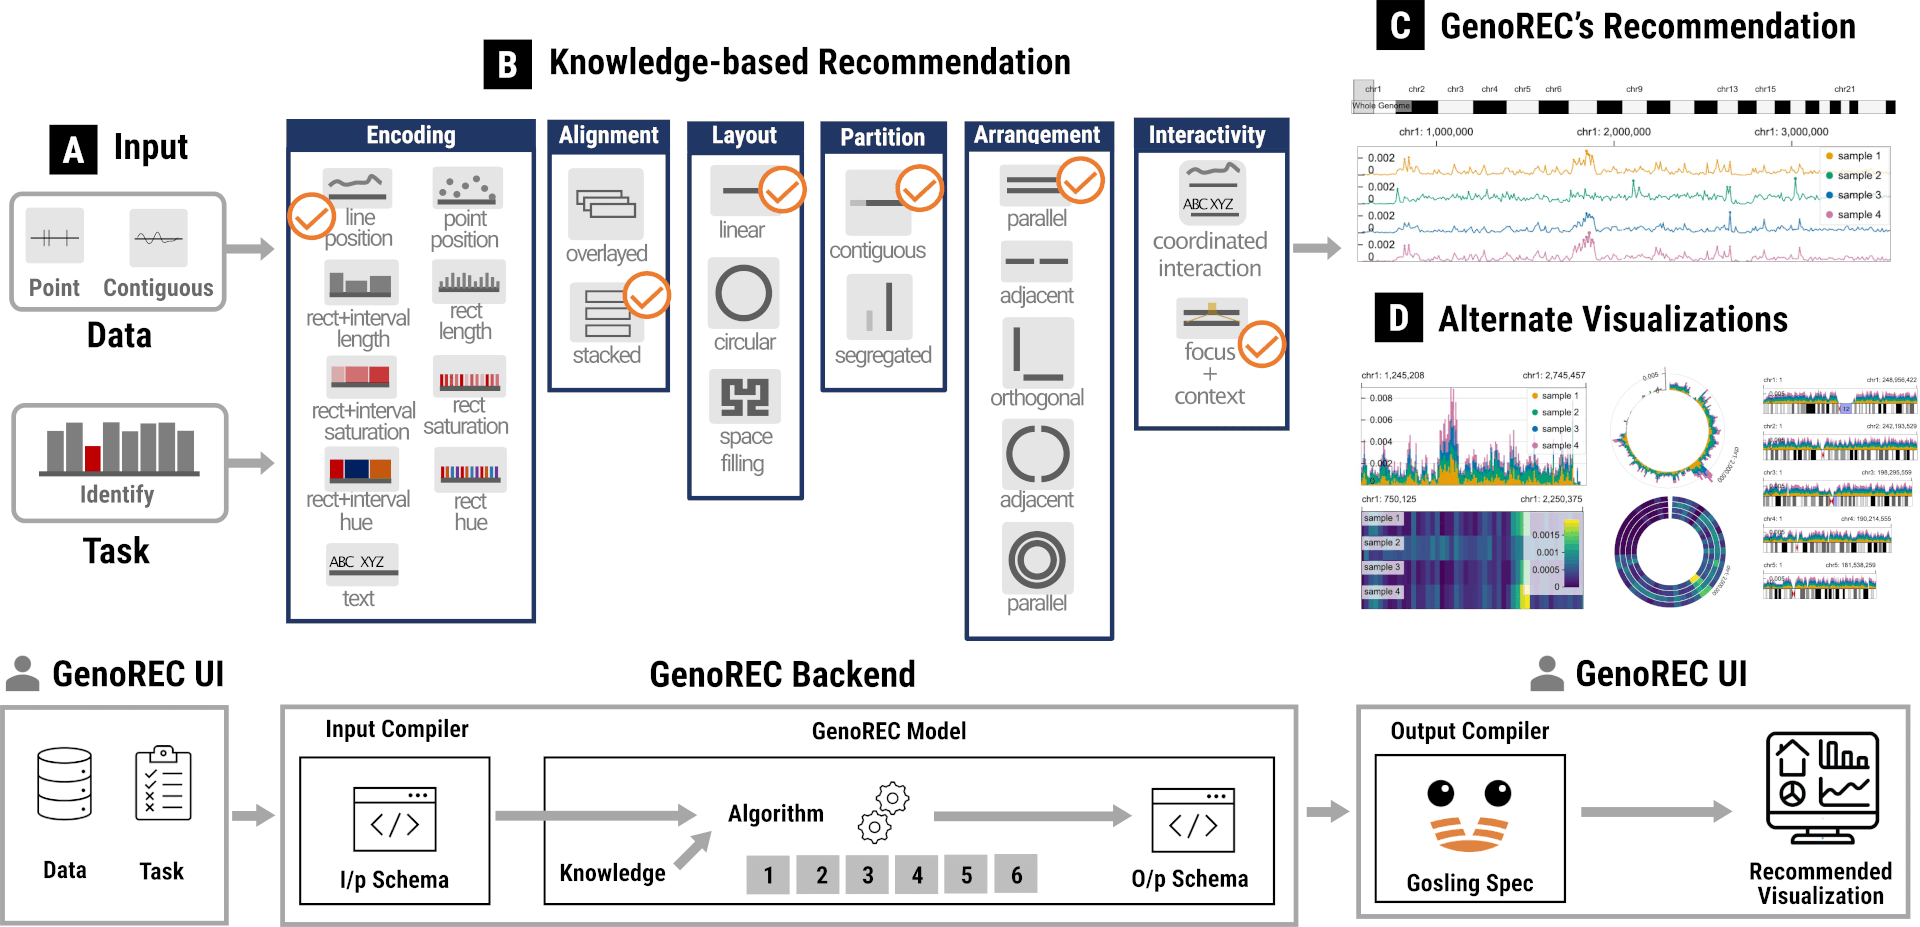
Interpretation of genomics data is critically reliant on the application of a wide range of visualization tools. A large number of visualization techniques for genomics data and different analysis tasks pose a significant challenge for analysts: which visualization technique is most likely to help them generate insights into their data? Since genomics analysts typically have limited training in data visualization, their choices are often based on trial and error or guided by technical details, such as data formats that a specific tool can load. This approach prevents them from making effective visualization choices for the many combinations of data types and analysis questions they encounter in their work. Visualization recommendation systems assist non-experts in creating data visualization by recommending appropriate visualizations based on the data and task characteristics. However, existing visualization recommendation systems are not designed to handle domain-specific problems. To address these challenges, we designed GenoREC, a novel visualization recommendation system for genomics. GenoREC enables genomics analysts to select effective visualizations based on a description of their data and analysis tasks. Here, we present the recommendation model that uses a knowledge-based method for choosing appropriate visualizations and a web application that enables analysts to input their requirements, explore recommended visualizations, and export them for their usage. Furthermore, we present the results of two user studies demonstrating that GenoREC recommends visualizations that are both accepted by domain experts and suited to address the given genomics analysis problem. All supplemental materials are available at https://osf.io/y73pt/.
Citation
A Pandey, S L’Yi, Q Wang, MA Borkin, N Gehlenborg. “GenoREC: A Recommendation System for Interactive Genomics Data Visualization”, IEEE Transactions on Visualization and Computer Graphics 29(1):570-580 (2022). doi:10.1109/TVCG.2022.3209407