Uchimata: a toolkit for visualization of 3D genome structures on the web and in computational notebooks
Abstract
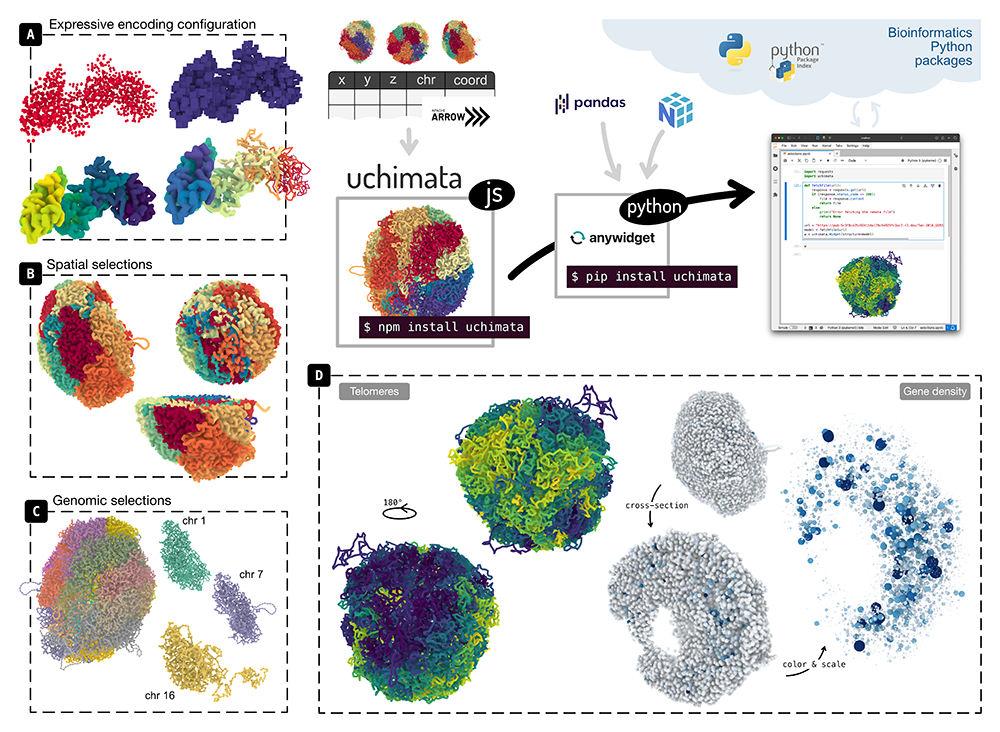
Summary: Uchimata is a toolkit for visualization of 3D structures of genomes. It consists of two packages: a Javascript library facilitating the rendering of 3D models of genomes, and a Python widget for visualization in Jupyter Notebooks. Main features include an expressive way to specify visual encodings, and filtering of 3D genome structures based on genomic semantics and spatial aspects. Uchimata is designed to be highly integratable with biological tooling available in Python.
Availability and Implementation: Uchimata is released under the MIT License. The Javascript library is available on NPM, while the widget is available as a Python package hosted on PyPI. The source code for both is available publicly on Github (https://github.com/hms-dbmi/uchimata and https://github.com/hms-dbmi/uchimata-py). The documentation with examples is hosted at https://hms-dbmi.github.io/uchimata/
Contact: david_kouril@hms.harvard.edu or nils@hms.harvard.edu.
Citation
D Kouřil, T Manz, T Clarence, N Gehlenborg. “Uchimata: a toolkit for visualization of 3D genome structures on the web and in computational notebooks”, arXiv (2025). doi:10.48550/ARXIV.2509.13290