EasyVitessce: auto-magically adding interactivity to Scverse single-cell and spatial biology plots
Abstract
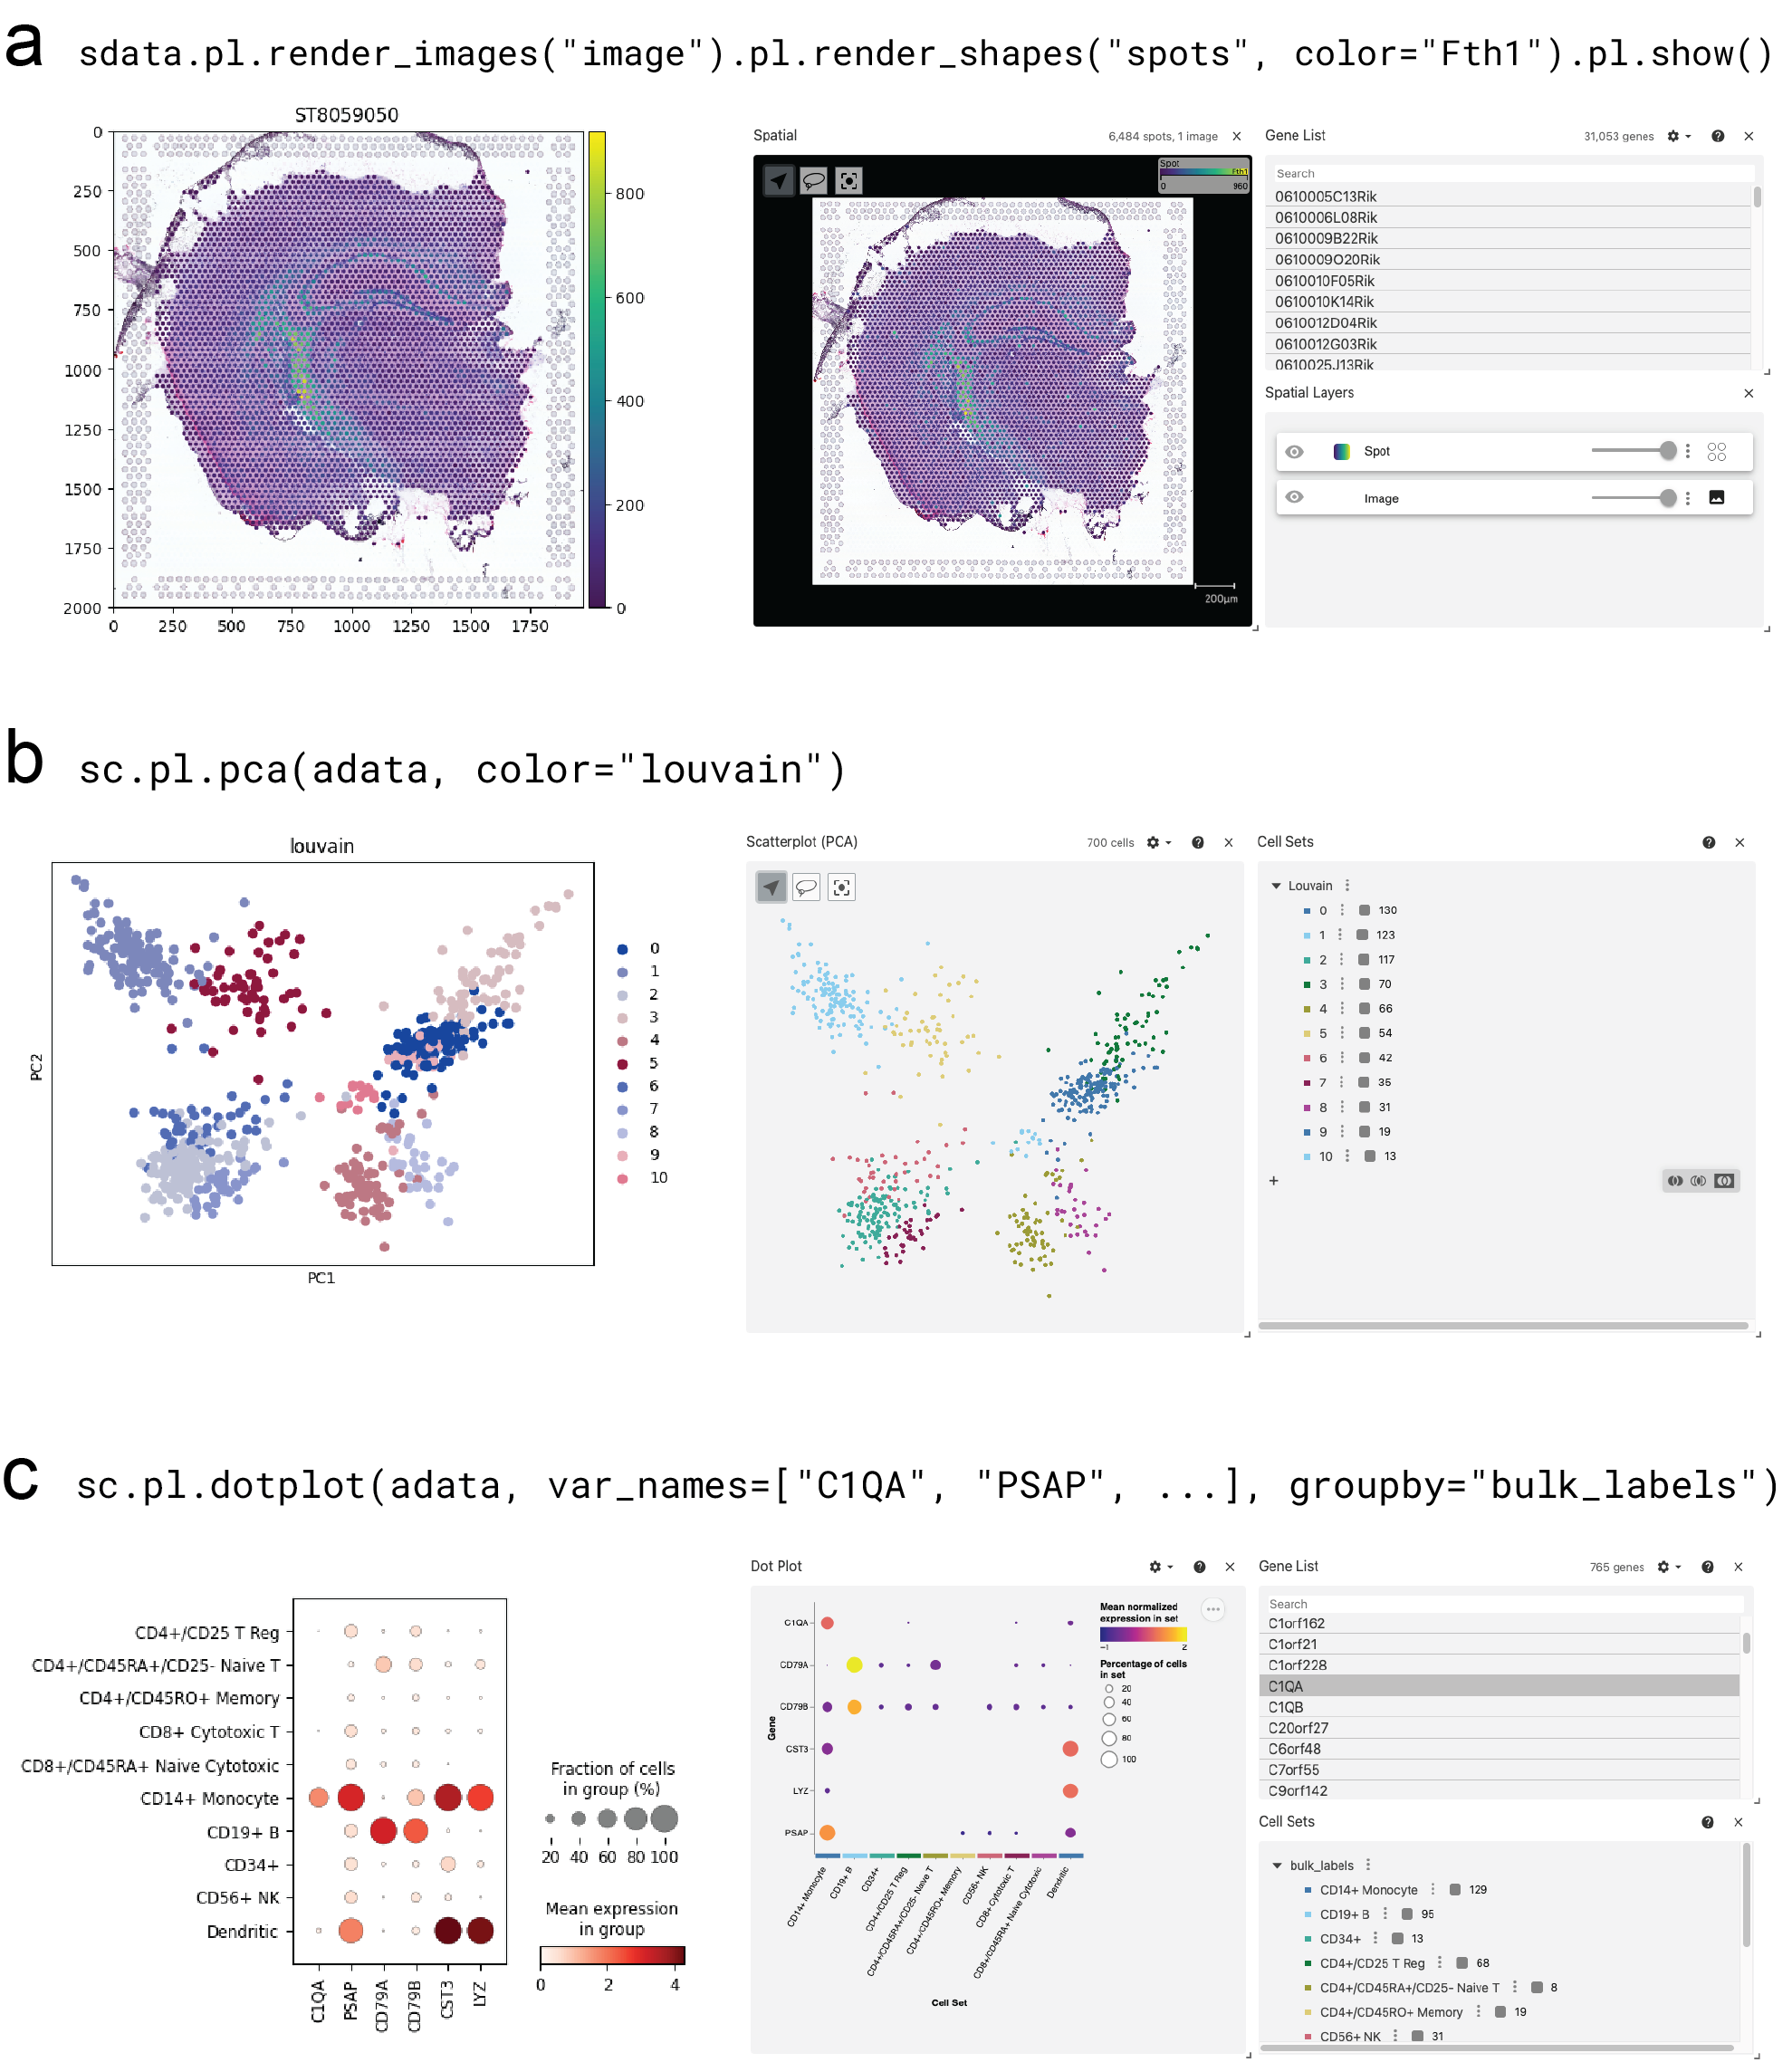
EasyVitessce is a Python package that turns existing static Scanpy and SpatialData plots into interactive visualizations by virtue of adding a single line of Python code. The package uses Vitessce internally to render interactive plots, and abstracts away technical details involved with configuration of Vitessce. The resulting interactive plots can be viewed in computational notebook environments or their configurations can be exported for usage in other contexts such as web applications, enhancing the utility of popular Scverse Python plotting APIs. EasyVitessce is released under the MIT License and available on the Python Package Index (PyPI). The source code is publicly available on GitHub.
Citation
S Luo, MS Keller, T Kakar, L Choy, N Gehlenborg. “EasyVitessce: auto-magically adding interactivity to Scverse single-cell and spatial biology plots”, arXiv (2025). doi:10.48550/arXiv.2510.19532