Explaining Unfamiliar Genomics Data Visualizations to a Blind Individual through Transitions
Abstract
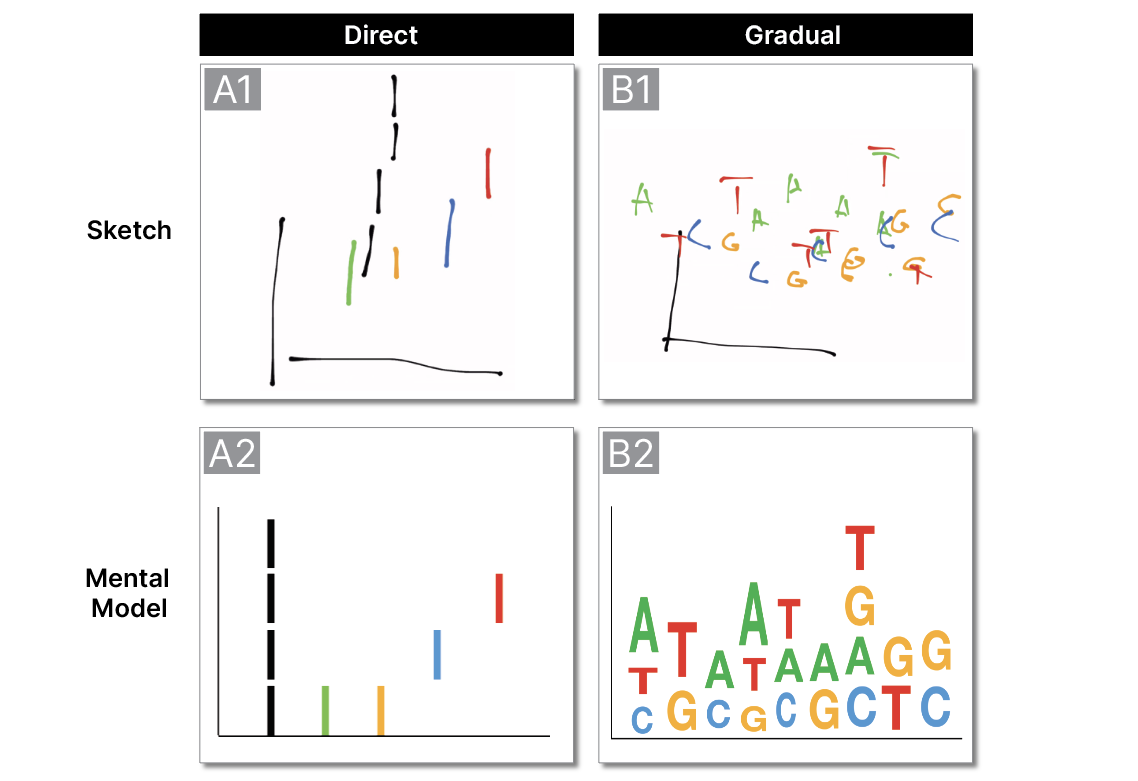
The introduction of novel visualizations through animated transitions is a well-established practice in visualization research. In our preliminary exploratory study, we investigate whether this approach could effectively facilitate the introduction of new visualization types to blind and low-vision (BLV) individuals. Specifically, we present two approaches, direct and gradual, to a user who is blind and compare their potential usefulness. The direct approach involved a single, comprehensive description of the visual elements, while the gradual approach utilized a series of visualizations and transitions, starting from familiar visualization types known to the user and progressing to the final, novel visualization. We introduce two genomics visualizations, sequence logos and Circos plots, to the user with descriptions and then ask them to sketch the visualizations to reflect their understanding of the visual elements. Feedback from the user indicates that the gradual approach was easier to follow, suggesting that BLV individuals could benefit more from this method. We outline our design process and insights from the study, and highlight key considerations for future research directions.
Citation
TC Smits, S L’Yi, HN Nguyen, AP Mar, N Gehlenborg. “Explaining Unfamiliar Genomics Data Visualizations to a Blind Individual through Transitions”, 2024 1st Workshop on Accessible Data Visualization (AccessViz) (2024). doi:10.1109/AccessViz64636.2024.00010