UpSetR
Description
UpSetR is an R package to generate static UpSet plots. The UpSet technique visualizes set intersections in a matrix layout and introduces aggregates based on groupings and queries. The matrix layout enables the effective representation of associated data, such as the number of elements in the aggregates and intersections, as well as additional summary statistics derived from subset or element attributes.
Gallery
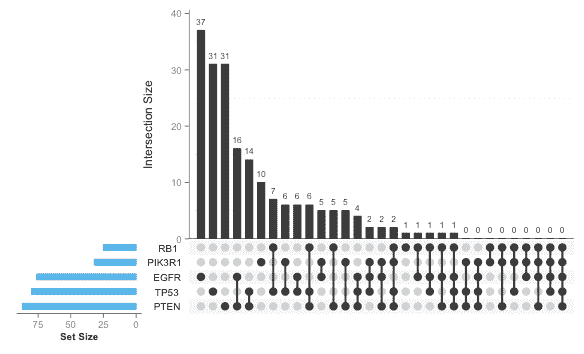 Screenshot of an image showing intersection of gene mutations in a cohort. The image consists of a black and white bar graph with numbers listed above each bar. Below the bar graph, right-justified to be aligned with the y-axis, are five gene names. Running along the bottom of the x-axis is a grid of light gray dots, with one dot corresponding to the intersection of each gene name row and bar column. Some of the dots are filled in black with vertical lines connecting them. To the left of the gene names is a horizontal bar plot. The bars are light blue and right justified.
Publications
Websites
- UpSetR R Package
-
UpSetR Shiny App
A web-based app to generate basic UpSetR plots.
Media
- The OpenHelix Blog (2014) - Video Tip of the Week: UpSet about genomics Venn Diagrams?
- "Looking for both effective and efficient representation of the types of data genomics researchers need, this interactive tool is a really nice way to explore which items belong in which subset. And, of course, which ones don’t. But that’s just the beginning."
Software
GitHub
Funding
- Visualization of (Epi)Genomic Data for Discovery of Disease-Associated Variants (NIH K99HG007583)
National Institutes of Health - NHGRI - Visualization of (Epi)Genomic Data for Discovery of Disease-Associated Variants (NIH R00HG007583)
National Institutes of Health - NHGRI